WE LOVE DATA EXPLORATION AND DATA VISUALIZATION!
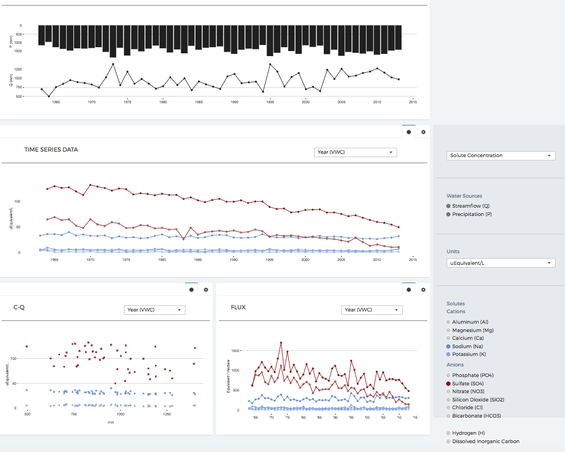
The Hubbard Brook Longterm Chemistry Record
|
Click on the static image above to visit our data story / data exploration platform for the Hubbard Brook longterm precipitation and stream chemistry record. This cool website was developed using the unprecedented dataset collected since 1963 by Dr. Gene Likens, the talent of three amazing Duke undergraduate students (Devri Adams, Annie Lott and Camila Vargas) and the leadership of Richard Marinos and Matt Ross. The work was funded and enabled by Duke's awesome summer Data+ program.
|
Measuring the pulse of streams - the StreamPULSE data platform
|
|
Click the static image above to visit the StreamPULSE data platform to learn about how we measure the metabolic regimes of flowing waters, check out or use our datasets and consider participating by adding your own. This website is the central hub of our NSF Macrosystems project aimed at understanding the seasonal and annual patterns of river energetics. This website was developed by data scientists Aaron Berdanier and Mike Vlah.
|
Map the loss of mountaintops over time
|
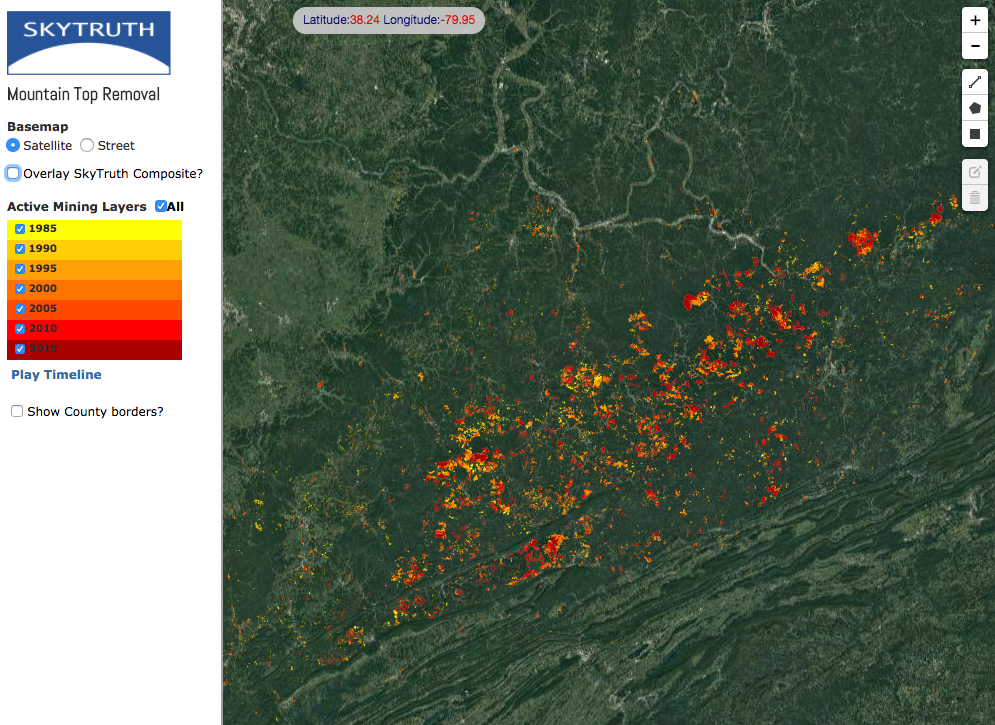
Click on the static image at left to see when and where mountaintop mines have impacted the landscape of Central Appalachia. Zoom in, zoom out and play the timeline to watch the impacts grow over time. This amazing application was built based on extensive landcover analysis work by Andrew Pericak in collaboration with the awesome folks at SkyTruth LLC and GoogleEarth Engine.
Click on this link for a GIF showing the expansion of mountaintop mining throughout Appalachia Read the paper that describes how this analysis was done. Access all of the underlying data here. |
A paired watershed study finds that mountaintop removal coal mining
enhances baseflows and dampens summer stormflows
|
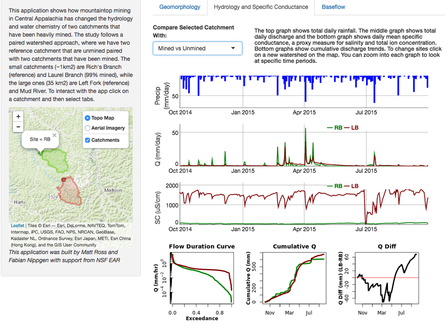
Click on the static image on the left to explore the hydrologic impacts of mountaintop mining based on datasets we collected in two pairs of Central Appalachian catchments. This data application was built by Matt Ross and Fabian Nippgen to accompany the paper Creating a more perennial problem? Mountaintop removal mining enhances and sustains baseflows of Appalachian watersheds.
|
Geomorphic change in central Appalachia due to mountaintop removal coal mining
|
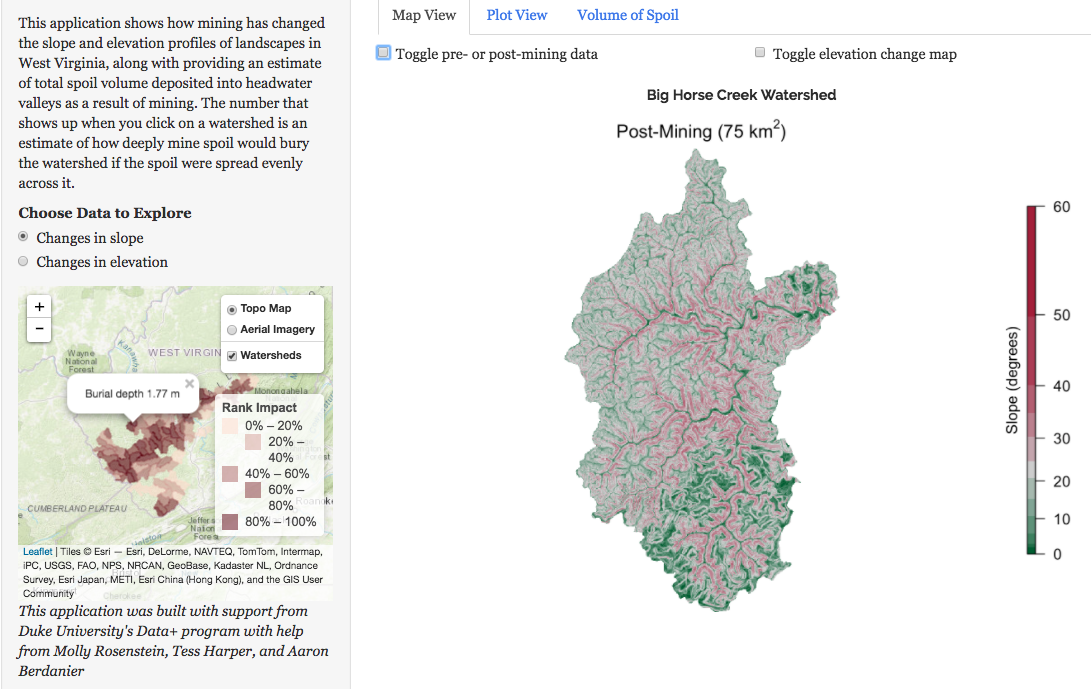
Click on the static image on the left to see how mountaintop removal coal mining has changed the landscape of every major watershed in West Virginia. You can look at maps or see the total volume of rock spoil that has been put into valley fills in each watershed. This awesome data visualization platform was created to accompany the paper Deep impact: Effects of mountaintop mining on surface topography, bedrock structure, and downstream waters. and was enabled by a great team of Duke undergraduates through Duke's Data+ program. Matt Ross and Aaron Berdanier provided the leadership and direction while Molly Rosenstein and Tess Harper learned a great deal about coding and Shiny packages.
|
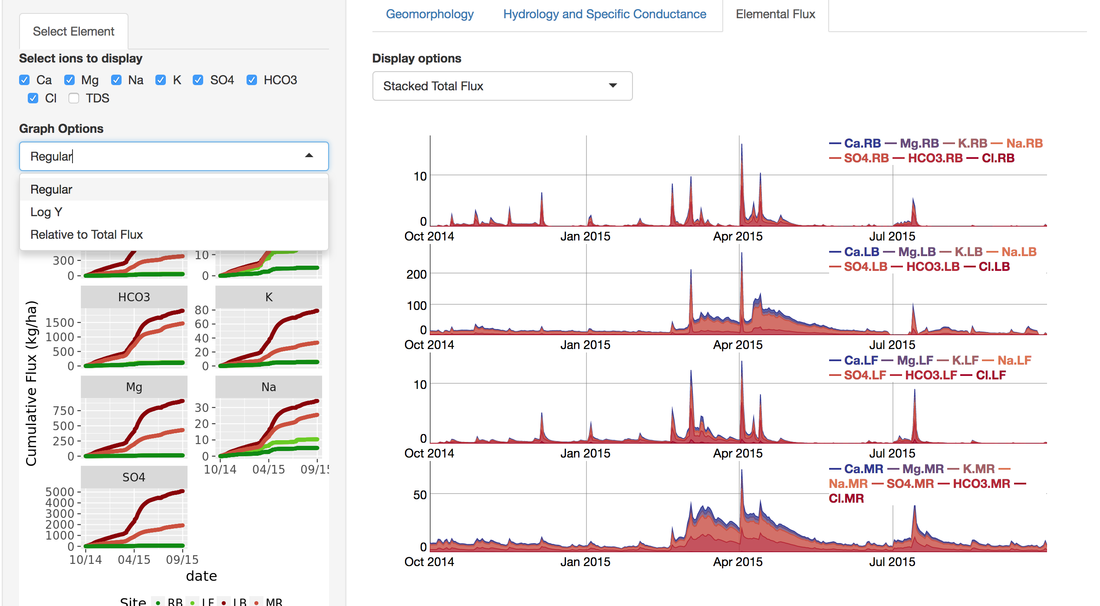
Chemical weathering and solute flux from mined vs. unmined Appalachian watersheds
|
Click on the static image on the left to examine solute concentrations and fluxes from two mined vs. ummined pairs of Central Appalachian watersheds.
This data visualization was created by Matt Ross to accompany his paper Pyrite Oxidation Drives Exceptionally High Weathering Rates and Geologic CO2 Release in Mountaintop‐Mined Landscapes |
Want to learn more?
Here is a great article about lab alumni Matt Ross and his Data Visualization Awakening.
Check out a few useful resources for working in R or Duke's great Data+ Program https://bigdata.duke.edu/data
